Good Morning Traders!
Today’s economic calendar kicks off the week with extremely limited data, setting the stage for a quieter session ahead of more impactful releases later in the week. The primary data point comes at 10:00AM ET with ISM Services PMI, which will provide insight into the health of the services sector and inflation pressures through its Prices Paid component.
Treasury activity continues with the 3 and 6 Month Bill Auction at 11:30AM ET. While today’s data is light, traders are already looking ahead to a much more significant second half of the week, including FOMC meeting minutes, PCE inflation data, and CPI. With major catalysts on deck, expect markets to remain somewhat position driven today as participants prepare for upcoming volatility.
Now, we will discuss SPY, QQQ, AAPL, MSFT, NVDA, GOOGL, META, and TSLA.
SPDR S&P 500 ETF Trust (SPY)
SPY is currently trading around 656.75 as markets begin the week with limited data and attention shifting toward major catalysts later in the week. If buyers defend this level early, a move toward 661.25 may develop, followed by 665.75 if momentum builds into the afternoon. Sustained strength above 670.00 would signal improving sentiment ahead of key inflation data.
If SPY loses 656.75 with conviction, sellers may press into 652.75. A breakdown there could expose 648.75, and continued weakness may bring the 644.50 region into focus. Expect positioning driven movement in a quieter session.
Invesco QQQ Trust Series 1 (QQQ)
QQQ is currently trading around 587.25 and remains sensitive to interest rate expectations heading into a data heavy back half of the week. If buyers defend this pivot, a push toward 592.00 may develop, followed by 596.75 if tech stabilizes. Sustained strength above 601.25 would indicate improving upside momentum in growth names.
If 587.25 fails to hold, sellers may drive price toward 582.75. A deeper breakdown could expose 578.50, and continued weakness may bring the 574.25 region into play. Semiconductors will likely lead direction.
Apple Inc. (AAPL)
AAPL is currently trading around 256.25 and attempting to hold recent gains. If buyers defend this level, price may rotate toward 260.00, followed by 263.75 if broader sentiment improves. Sustained strength above 267.50 would indicate renewed institutional demand.
If 256.25 breaks lower, sellers may test 252.75 quickly. Continued downside pressure could extend into 249.50, and deeper weakness may bring the 246.25 region into focus.
Microsoft Corp. (MSFT)
MSFT is currently trading around 375.00 and working to stabilize after recent weakness. If buyers reclaim 379.50, price may push toward 384.25, followed by 389.00 if momentum builds. A sustained move above 393.50 would signal improving structure in large cap tech.
If 375.00 fails to hold, sellers may press into 370.75. A deeper pullback could test 366.50, and continued weakness may bring the 362.25 region into play.
NVIDIA Corporation (NVDA)
NVDA is currently trading around 178.00 and remains a key driver of semiconductor sentiment. If buyers defend this pivot, a move toward 182.75 may develop, followed by 187.50 if chip strength returns. Sustained trade above 191.75 would indicate renewed upside momentum in the AI space.
If 178.00 breaks lower, sellers may test 174.25 quickly. Continued downside could extend into 170.50, and deeper weakness may bring the 166.75 region into focus.
Alphabet Inc Class A (GOOGL)
GOOGL is currently trading around 296.50 and attempting to reclaim the 300 level. If buyers defend this area, price may rotate toward 300.75, followed by 305.25 if communication services strengthen. Sustained strength above 309.75 would indicate improving upside participation.
If 296.50 fails to hold, sellers may guide price toward 292.75. A breakdown there could expose 288.75, and continued weakness may bring the 284.50 region into play.
Meta Platforms Inc (META)
META is currently trading around 579.50 and consolidating after recent volatility. If buyers defend this pivot, a push toward 586.25 may develop, followed by 592.75 if momentum builds. Sustained strength above 599.50 would indicate a stronger recovery attempt.
If 579.50 breaks lower, sellers may guide price toward 573.75. A deeper pullback could test 568.25, and continued weakness may bring the 562.75 region into focus.
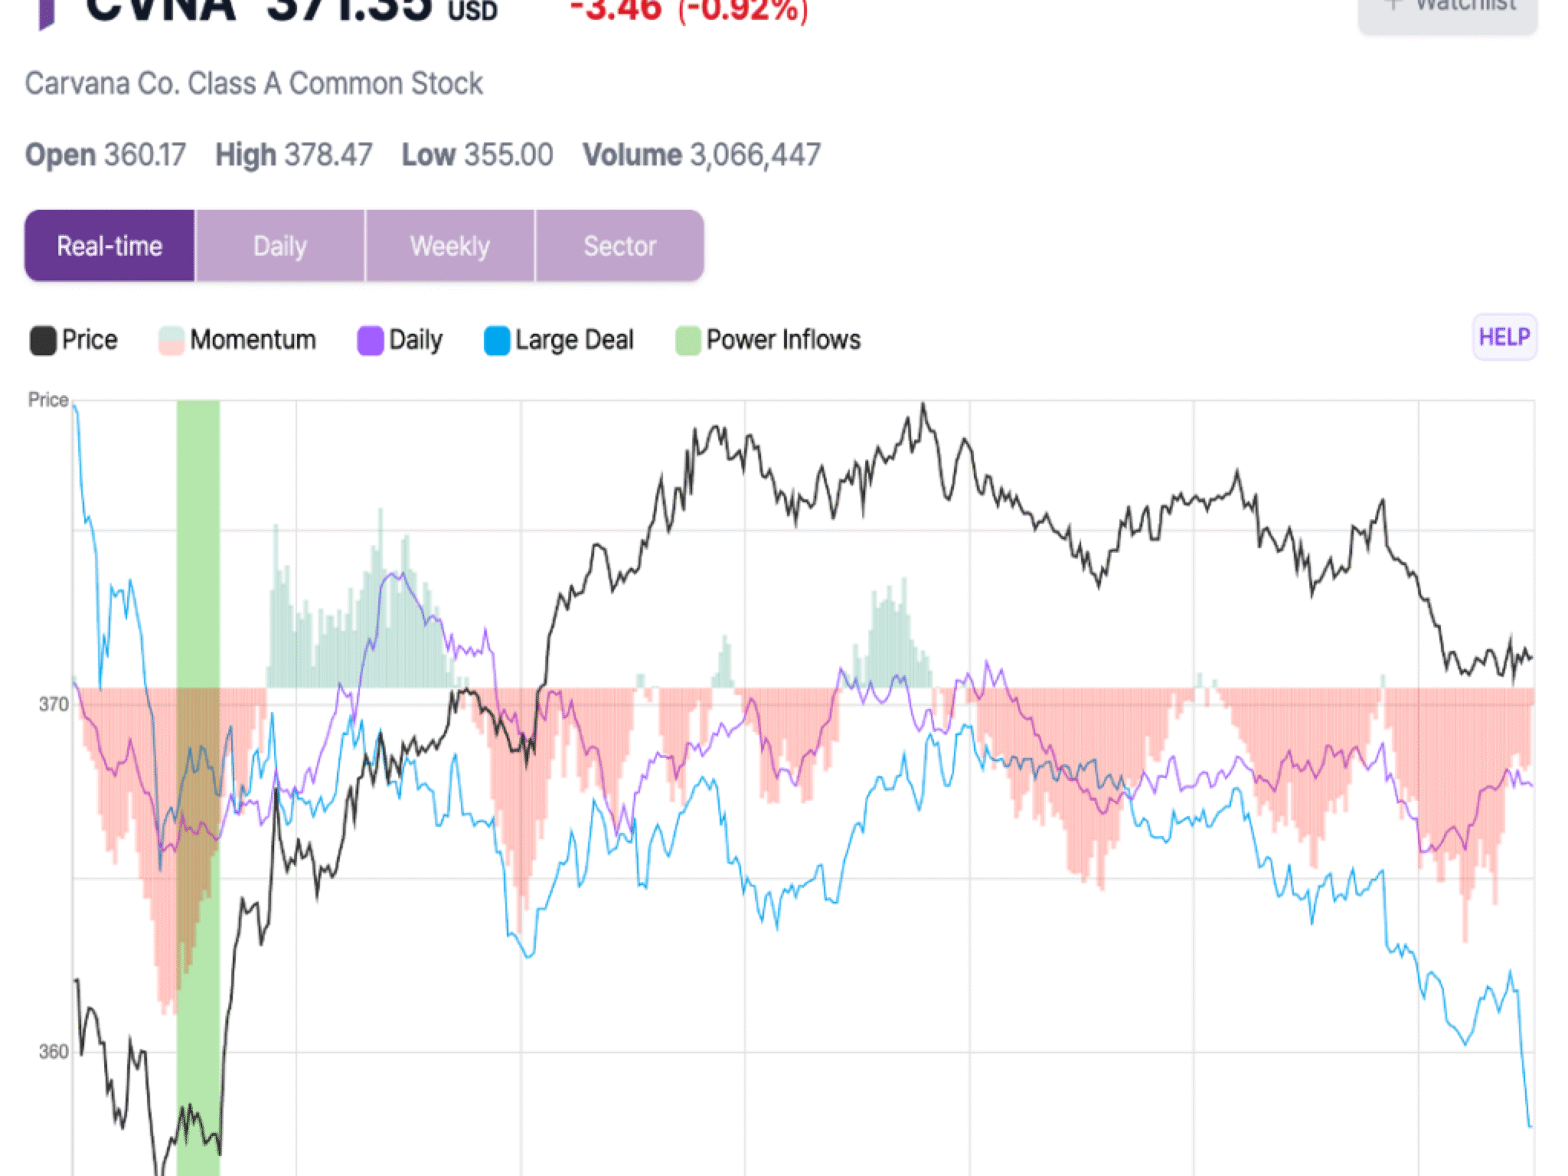
Tesla Inc. (TSLA)
TSLA is currently trading around 364.25 and remains highly reactive to broader market flows. If buyers defend this pivot, a move toward 370.75 may develop, followed by 377.25 if speculative momentum builds. Sustained strength above 383.75 would indicate stronger upside participation.
If 364.25 fails to hold, sellers may test 358.75 quickly. Continued downside pressure could extend into 353.25, and deeper weakness may bring the 347.75 region into play.
Final Word: Good luck and trade safely!
Benzinga Disclaimer: This article is from an unpaid external contributor. It does not represent Benzinga’s reporting and has not been edited for content or accuracy.